Free Procurement KPI Tracker Template + Dashboard Guide

Free Procurement KPI Tracker Template + Dashboard Guide
If you're part of a procurement team that wants to show its value, tracking key performance indicators (KPIs) with a procurement KPI dashboard is the best way to have quantifiable data at your fingertips. With the right tool, you can monitor the most essential procurement numbers, compare goals to actuals, and consider year-over-year progress.
The free template included below provides procurement managers with an at-a-glance view of top-level procurement metrics. It's easy to use and customizable so you can track the metrics that matter most to your organization.
Key points:
- Procurement KPIs measure purchasing performance. They track cost, speed, quality, and compliance, from spend under management to PO cycle time.
- A template sets the baseline. You can use a spreadsheet to record actuals, set goals, and compare year-over-year progress.
- A dashboard keeps the numbers current. Dashboards pull live data from your ERP and purchasing systems into spend, delivery, quality, and compliance views.
- Order.co captures KPI data at the point of purchase. Curated catalogs keep buying on one platform, line-item GL coding gives finance real-time visibility, and AI flags unusual orders and surfaces better-priced vendors.
Download the free tool: Procurement KPI Tracker Template
How to use this worksheet
- Download the Procurement KPI Tracker using this link.
- Save the Excel workbook to your local drive and enter current procurement data as outlined in the instructions tab.
- View the last four (protected) tabs for cumulative data on past year actuals, current year actuals, current year goals, and comparisons.
What are KPIs for procurement?
Procurement management KPIs are metrics used to measure the performance and efficiency of purchasing activities and processes. You can use them to monitor progress against goals, set targets, and benchmark performance against similar organizations.
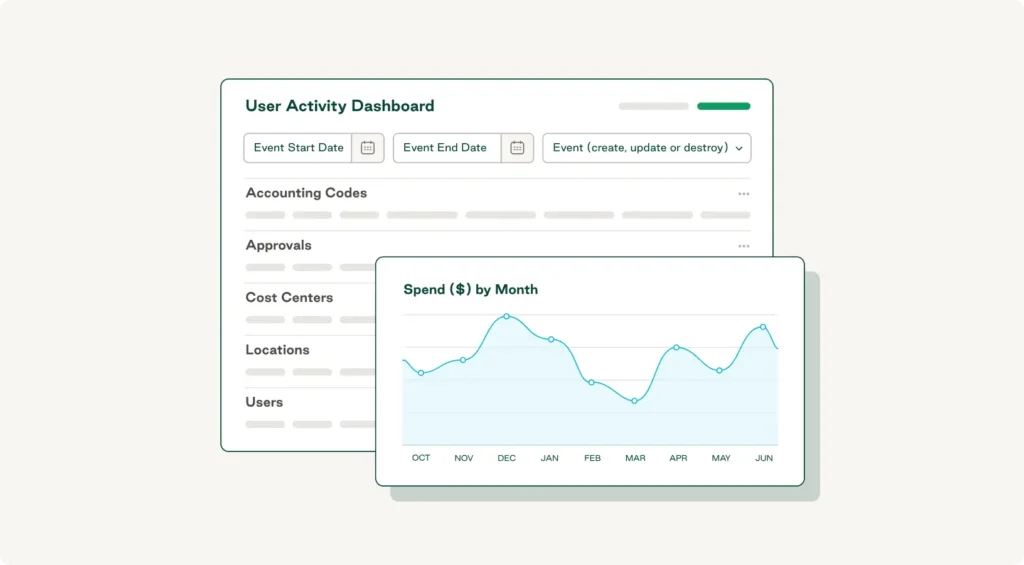
Here are some popular procurement KPIs for tracking progress:
- Total procurement cost
- Total spend
- Monthly cost savings
- Total inventory cost
- Procurement ROI
- Average cycle time
- Delivery time or lead time
- Average supplier count
- Total items purchased
- Item defect rate
- Item quality rating
- Purchase order processing costs
- Cost avoidance
- Cost reduction
- Compliance rate
- Total number of suppliers
- Spend under management
- Expense ratio
- Year-over-year spend change
- Total vendor contracts
KPI reference table
| Category | KPI description | Measurement |
| Procurement Management | Total procurement cost | Dollars |
| Procurement Management | Monthly cost savings | Dollars |
| Procurement Management | Total inventory value | Dollars |
| Procurement Management | Procurement ROI | Percent |
| Delivery | Avg. PO cycle time | Days |
| Delivery | Avg. delivery lead time | Days |
| Delivery | Supplier count | Total |
| Quality | Total items purchased | Total |
| Quality | Item defect rate | Percent |
| Quality | Quality rating | Total |
| Finance | PO processing cost | Dollars |
| Finance | Cost avoidance (total) | Dollars |
| Finance | Cost reduction (total) | Dollars |
| Finance | Expense ratio | Percent |
| Warehousing and Logistics | Avg. inventory cost | Dollars |
| Warehousing and Logistics | Inventory turnover | Total |
| Warehousing and Logistics | Holding cost | Dollars |
| Warehousing and Logistics | Stock-out | Total |
| Warehousing and Logistics | Service level | Total |
Ready to improve your procurement KPIs?

Free Editable Procurement KPI Spreadsheet
Track procurement performance, uncover opportunities, and show the value your strategy delivers.
How do I track procurement KPIs?
KPI tracking is as simple or complex as your needs require. If you're setting a baseline or proving the value of a new procurement strategy, a spreadsheet-based tracker gives you enough structure to get started.
These steps will help you get the most from a tracking template:
- Gather all current and historical data on the procurement function. This information is likely spread across various financial, purchasing, accounting, and stakeholder data sets.
- Establish goals for the procurement function that align with larger business objectives. For instance, if your organization wants to reduce costs, consider tracking KPIs like monthly cost savings or cost avoidance.
- Input KPIs into a tracking system accessible to the relevant procurement team members. This tracking spreadsheet provides the framework for getting started and is customizable to suit your business needs.
- Set targets for each KPI. Realistic, achievable goals for the given period provide you with clear benchmarks.
- Collect procurement data from supplier reports, internal reports, and vendor performance reviews. Reviewing the data will help you identify anomalies or areas for improvement.
- Analyze collected data to understand procurement spend and procurement trends. This analysis reveals opportunities to reduce costs or increase the efficiency of purchasing activities and processes.
- Create a dashboard with visualized data. A dashboard lets stakeholders monitor the progress of procurement KPIs compared to goals and gives an overall assessment of procurement health.
Benefits of tracking procurement KPIs
For procurement, it leads to better outcomes and revenue retention that affect the entire organization. When you regularly monitor your most important KPIs, you'll often see these benefits.
Increased visibility. Centralizing data is the first step to successful KPI tracking. Centralization increases visibility into the entire procurement process, while dashboards and reports let stakeholders track ongoing KPI progress and gain a real-time view of fluctuations.
Greater efficiency. When you know what works and what doesn't, you can focus effort and budget on the activities that matter. Tracking reveals where to trim processes or spending, improving procurement efficiency.visibility: Centralizing data is the first step to successful KPI tracking. Centralization increases visibility into the entire procurement process, while dashboards and reports allow stakeholders to track ongoing KPI progress and gain a real-time view of fluctuations.
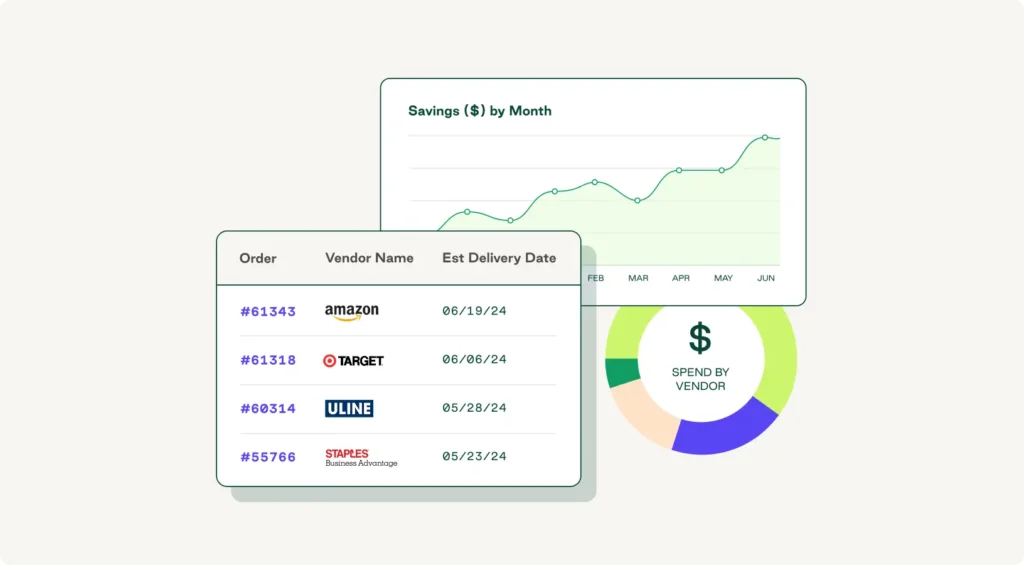
Cost-saving opportunities. Visibility into procurement lets you research the cost-effectiveness of purchasing activities and reduce costs associated with sourcing goods and services. You can use the data for spend analysis, a clearer understanding of supplier performance, and better sourcing decisions.
Procurement numbers and trends highlight improvements that can lead to procurement savings. For instance, if you find delays or disruptions that result in additional expenses, you can adjust your processes or shift toward more reliable vendors.
Stronger negotiation. Procurement data visibility helps you build stronger data narratives for negotiations. With detailed data on the performance of individual vendors, you can identify reliable partners that objectively provide the best value for money, then use that information to secure better payment terms or discounts.
Better supplier relationships. Visibility strengthens relationships with your most important vendors.
Faster cycle times. Clean, up-to-date data and strong vendor relationships shorten your purchase order cycle time.
Course correction. Regularly tracking KPIs with a procurement KPI dashboard lets you monitor the success of the strategies you've implemented. It shows whether your assumptions about procurement experiments are correct and provides data for further refinement and increased profitability.
Demonstrated value. With the right strategies in place, procurement becomes a value-creation center for your organization. Quantifiable data on procurement performance helps your team show its work.
Building a procurement KPI dashboard
A spreadsheet tells you where you stood last month. A procurement KPI dashboard built in a specialized tool uses procurement analytics to turn complex data into an accessible and actionable visualization.
The payoff shows up in results. In Deloitte's Global Chief Procurement Officer Survey, 96% of "Digital Masters," the survey's leading procurement organizations, met or exceeded their cost-savings plans, compared with 80% of followers.
Follow these steps to build yours:
- Identify KPIs. Start by selecting the KPIs most relevant to your procurement management objectives. Keep the main view to 8 to 12 metrics.
- Choose dashboard software. Business intelligence tools like Tableau, Power BI, or Databox work well if you have analyst support, while many procurement analytics software options build reporting into the purchasing workflow.
- Gather and integrate data. Connect your dashboard to every source that feeds your KPIs, usually your enterprise resource planning (ERP) system, invoice processing and AP tools, supply chain management (SCM) platforms, and card programs.
- Design the dashboard layout. Group related KPIs into sections (see the categories below) and decide which need real-time updates. Build custom dashboards for each audience, since a CFO needs different views than a category manager. These AP reporting dashboards show what finance leaders typically look for.
- Implement visualization tools. Use trend lines for cycle times, gauges for compliance rate against target, and bar charts for spend by category or vendor.
- Train the team. Make sure everyone who relies on the dashboard knows how to read and interpret it.
- Update and maintain the dashboard. Revisit your KPIs and layout as business needs change.
Example: what a finished procurement KPI dashboard looks like
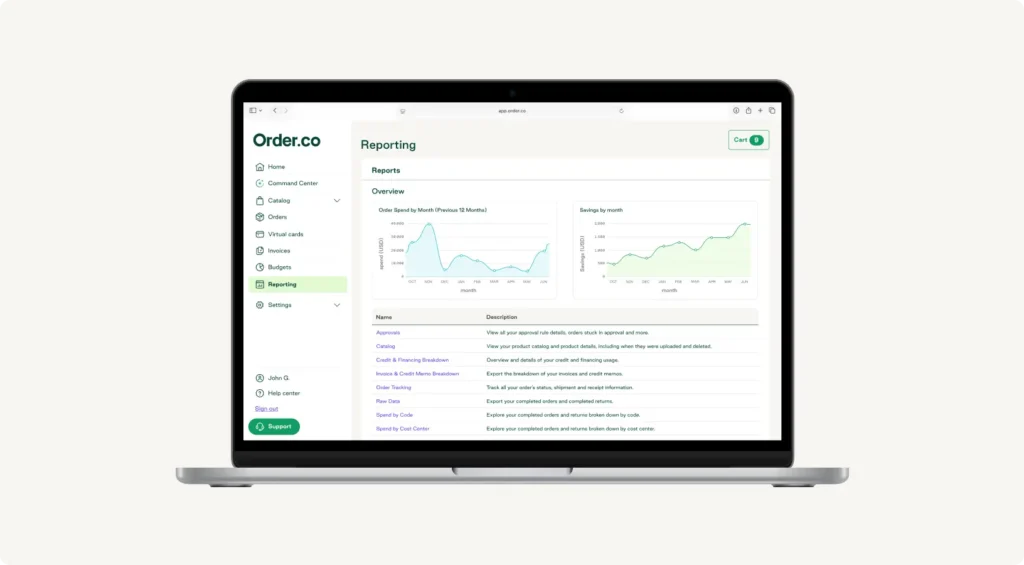
Picture a monthly dashboard for a VP of procurement overseeing dozens of locations. It might show details like order spend and savings trends over time, with views for approvals, order tracking, invoices, raw data, spending by code, and spending by cost center.
How to organize KPIs on a procurement dashboard
The reference table above is a flat list. A dashboard needs structure, so group your KPIs by the question each view answers. Start with spend under management, since it determines how much of your spend the rest of the dashboard can see. According to Ardent Partners' The Procurement Metrics that Matter in 2025 eBook, procurement teams now manage an average of 71% of enterprise spend, and every additional dollar brought under management yields savings of 6% to 12% during the initial contract period.
| Dashboard view | KPI | How to calculate it |
| Spend and cost | Spend under management | Spend managed by procurement ÷ total spend × 100 |
| Spend and cost | Cost savings and cost reduction | Baseline cost − new cost, tracked monthly |
| Spend and cost | Cost avoidance | Price increase or expense prevented, versus what you would have paid |
| Spend and cost | Purchase price variance (PPV) | (Actual price − standard price) × quantity purchased |
| Spend and cost | Procurement ROI | Procurement savings ÷ procurement operating cost |
| Delivery | PO cycle time | Days from requisition approval to PO issued |
| Delivery | Supplier lead time | Delivery date − order date |
| Delivery | On-time delivery rate | On-time deliveries ÷ total deliveries × 100 |
| Delivery | Stockouts and inventory turnover rate | Stockout events per period; cost of goods sold ÷ average inventory |
| Quality | Supplier defect rate | Defective units ÷ total units received × 100 |
| Quality | Total cost of ownership | Purchase price + delivery, maintenance, returns, and disposal costs |
| Compliance | Contract compliance rate | Spend at contracted terms with contracted vendors ÷ total addressable spend × 100 |
| Compliance | Rogue spend rate | Off-contract or unapproved spend ÷ total spend × 100 |
Delivery and quality views work best together, since a vendor with a fast lead time and a high defect rate still costs you money. Pair them with a supplier performance management process so the numbers feed directly into vendor conversations.
Common KPI tracking challenges
Even well-designed KPI programs run into the same few problems.
Fragmented data sources
Purchasing data rarely lives in one place. Location managers log into separate vendor websites, approvals happen in email threads, and some purchases land on corporate or personal cards because it's faster than waiting for a PO. That off-system buying is rogue spend, and it never shows up in your KPIs.
How a dashboard helps. A dashboard connected to your ERP, AP, and purchasing systems pulls every source into one view, so gaps in your data become visible right away.
Inconsistent metric definitions
One team measures PO cycle time from requisition submission, another from approval. One region counts a negotiated price hold as cost savings, another calls it cost avoidance. When definitions drift, you can't compare your numbers across teams or quarters.
How a dashboard helps. Defining each formula once in the dashboard means every location and category is measured the same way, every time.
Tracking too many metrics
A 40-metric report looks thorough, but it buries the three numbers that should drive action this month. A focused procurement analysis helps you decide which KPIs matter most for your goals.
How a dashboard helps. A dashboard forces prioritization. Headline KPIs sit on the main view, each with an owner and target, and supporting metrics move into drill-downs.
Static reports that go stale
A manually built monthly spreadsheet is out of date the day it circulates.
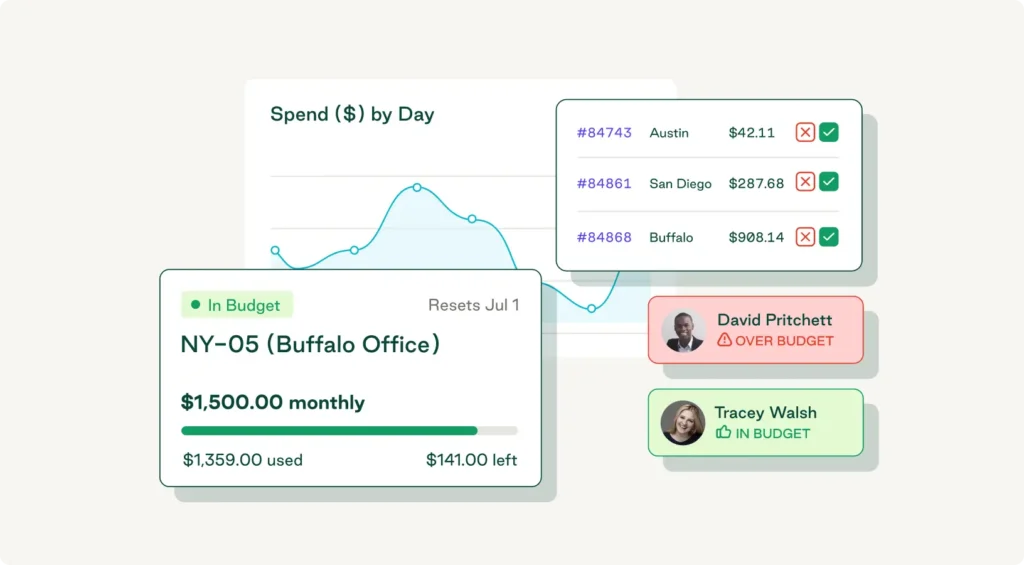
How a dashboard helps. Real-time dashboards refresh automatically, so you catch issues while you can still act on them. Spend analysis tools and a spend analysis dashboard make it easier to spot patterns across vendors and categories as they form.
Free Editable Procurement KPI Spreadsheet
"*" indicates required fields
Use Order.co to simplify tracking procurement KPIs
An Excel spreadsheet or homegrown procurement KPI dashboard gets harder to keep accurate, and it's worth comparing the best procurement software for your team. Your KPIs are only as reliable as the purchasing data behind them, and that data is only complete when your team actually buys through the system.
Order.co's procurement platform captures that data at the point of purchase:
- Buying that fits how your team works. Curated catalogs of pre-approved products and vendors make the compliant choice the easy one. Your team can buy from any vendor you bring or tap into a 40,000+ vendor network, so purchases stay on one platform, and your compliance rate and spend under management reflect reality.
- Real-time visibility for finance. Budgets update in real time, and every line item is GL-coded at the moment of purchase. Invoice data syncs to QuickBooks, NetSuite, Sage Intacct, or Workday, and built-in reporting lets you run spend analyses, track spend by location, and analyze vendors.
- AI that informs decisions. AI insights for approvals flag orders that deviate from historical spending patterns. The sourcing algorithm finds the best price or options for out-of-stock goods, and vendor recommendations factor in price, delivery speed, availability, and reliability.
"[Order.co AI] shows me how consistent an order is with historical spending patterns," says Lucky Weeras, Procurement Manager at Fitness Formula Clubs, which manages 180+ vendors across 11 locations.
To see how Order.co helps you maintain strong procurement performance, schedule a demo today.
FAQs about tracking procurement KPIs
A procurement KPI template is a spreadsheet where you record baselines, goals, and actuals for each metric, usually updated by hand. A procurement KPI dashboard connects to your purchasing, ERP, and AP systems and visualizes the same KPIs automatically. Many teams start with a template to agree on metrics and targets, then move to a dashboard once they need real-time data and drill-downs.
Start by automating data collection so your KPIs don't depend on manual exports from multiple systems. Define every metric's formula once so each team measures it the same way, and limit your main view to the handful of KPIs that drive decisions. A centralized dashboard that refreshes automatically keeps reporting current.
Regular tracking gives you and your vendors a shared, objective view of performance. When you review metrics like on-time delivery rate, supplier defect rate, and price variance together, conversations shift from anecdotes to data. That transparency builds trust, makes negotiations more productive, and shows which vendors deserve more of your business.
Spreadsheets work for setting a baseline, but they get harder to maintain as you add vendors, categories, and locations. Manual updates introduce errors, and the data is always a few weeks old. Dedicated procurement platforms capture purchasing data automatically at the point of purchase, so your KPIs stay accurate across vendors and categories.
Refresh frequency depends on the metric. Spend, compliance rate, and order status benefit from real-time or daily updates, while vendor defect rate and total cost of ownership usually make sense monthly or quarterly. Review the KPIs themselves at least once a year, and whenever your goals, locations, or vendor mix change, so every metric on the main view still drives a decision.
Get started
Schedule a demo to see how Order.co can simplify buying for your business.
"*" indicates required fields