Variance Report Template: The Complete Guide for Finance Teams

Variance Report Template: The Complete Guide for Finance Teams
For finance teams running multi-location operations, the hardest part of variance reporting is getting clean, line-item data for every entity before the books close. When purchasing is decentralized, spend lives in dozens of vendor portals, email inboxes, and personal card statements, and the variance report becomes a forensic exercise rather than a decision-making tool.
A consistent variance report template gives your finance team visibility into where actuals diverge from plan at the line-item level, context to distinguish location-specific issues from systemic ones, and the speed to catch budget drift while there's still time in the quarter to recover.
Key takeaways: variance report template
- A variance report compares budget to actuals at the account, department, or location level to expose where assumptions broke down.
- For multi-location operators, variance analysis is most valuable when it isolates whether a gap is location-specific or systemic across the business.
- Sign conventions trip up most readers: A negative expense variance is favorable, while a negative revenue variance is not.
- A standardized template makes variance reporting repeatable so that finance teams can run the analysis on a fixed cadence instead of rebuilding from scratch.
- Order.co pre-codes every line item to the correct GL account, cost center, and location at the moment of purchase, surfaces anomalies as they happen, and gives finance and ops one shared view of spend.
Download the free tool: Variance Report Template
What is a variance report?
A variance report is a financial analysis tool that compares your actual performance against your planned or budgeted performance. It shows you where your team's expectations diverged from what actually happened over a period, whether a quarter, a fiscal year, or a single close cycle, and gives you the context to make informed decisions and course-correct where needed.
Variance reports are key to strong financial management. They're useful for identifying and addressing common budget pitfalls, such as:
- Operational inefficiencies: Cost overruns from inconsistent purchasing across locations
- Unexpected costs: Emergency vendor orders, rush shipping, off-contract purchases, or supplier price increases
- Inaccurate business assumptions: Budgets built on stale unit economics or outdated volume forecasts
- Market changes: Input cost inflation, tariff shifts, or demand swings
Variances between your production or purchasing budgets and actuals show you where your assumptions drifted from outcomes. Identifying that gap helps your finance team refine the forecasting process period over period.
Why are variance reports important?
For organizations with multiple locations or cost centers, variance reporting becomes essential to reveal whether variances are location-specific or systemic. A 12% overspend on cleaning supplies at one childcare center is a manager conversation, whereas the same overspend across 40 centers may require a vendor renegotiation, a category sourcing project, or a policy change. Variance reports are how finance teams tell these scenarios apart.
Variance reports also expose where buying patterns have drifted apart across the business. When your team buys the same SKU at three different prices across regions, the report surfaces the gap. That's the data your finance team needs to renegotiate a contract or justify migrating to a centralized purchasing system. When anomalies surface early, your team has time to course-correct before they compound.
Variance Report Template
A variance report is a valuable tool to understand your spend and keep budget and actuals aligned. Use our template to track production and purchasing costs.
When do you need a variance report?
Your financial planning and analysis (FP&A) function gets the most out of variance reporting when it runs on a consistent cadence.
Key moments make the analysis especially valuable:
- During monthly, quarterly, or annual financial reviews: Assess how the business adhered to the budget in the prior period or previous year and identify areas of over- or underspending.
- After testing new business strategies: Evaluate the financial impact of strategic changes and adjust forecasts accordingly.
- When experiencing market fluctuations: Understand how external changes affect your team’s financial performance against planned budgets. Compare data from historical purchase requisitions or purchase orders to see where shifts affect spending.
- At the start of budget season: Refine assumptions based on prior performance before building the next plan.
- Following major organizational change: Gauge the financial impact of mergers, acquisitions, new location openings, or shifts in strategic direction.
A consistent variance report template makes analysis repeatable across all five triggers, allowing your finance team to catch issues on a fixed cadence rather than only running reports when a problem is already obvious.
How to read a variance report
Variance reports use favorable/unfavorable logic that can be confusing at first. A negative variance on an expense line is favorable because actual spending came in under budget, while a negative variance on a revenue line is unfavorable because actual revenue came in below plan.
Most templates label these explicitly, but reviewers who skim the numbers without checking the labels may misread the report. Start every analysis by confirming what each column actually means.
With sign conventions established, work through the report in six steps:
- Examine expenses and revenues. Your budget and actuals need to align across both spending and revenue. A revenue bump is great, but if your team is also overspending, the net result washes out.
- Identify relevant variances. Focus on changes between actual results and budgeted figures, but go deep enough to see them at the line-item level. A collection of small but persistent variances, like a minor purchase price variance (PPV) on a single SKU bought across many locations, can eventually accumulate into a material number. Line-item visibility surfaces these patterns, while rolled-up category totals often mask them.
- Review non-financial metrics. Look at operational metrics that might explain financial outcomes. This could include customer satisfaction scores, market trends, headcount changes, or input availability affecting production and materials costs.
- Assess assumptions against outcomes. Compare the assumptions made during budgeting with what actually happened during a given period. Understanding where your budget assumptions broke down is what improves the next forecast.
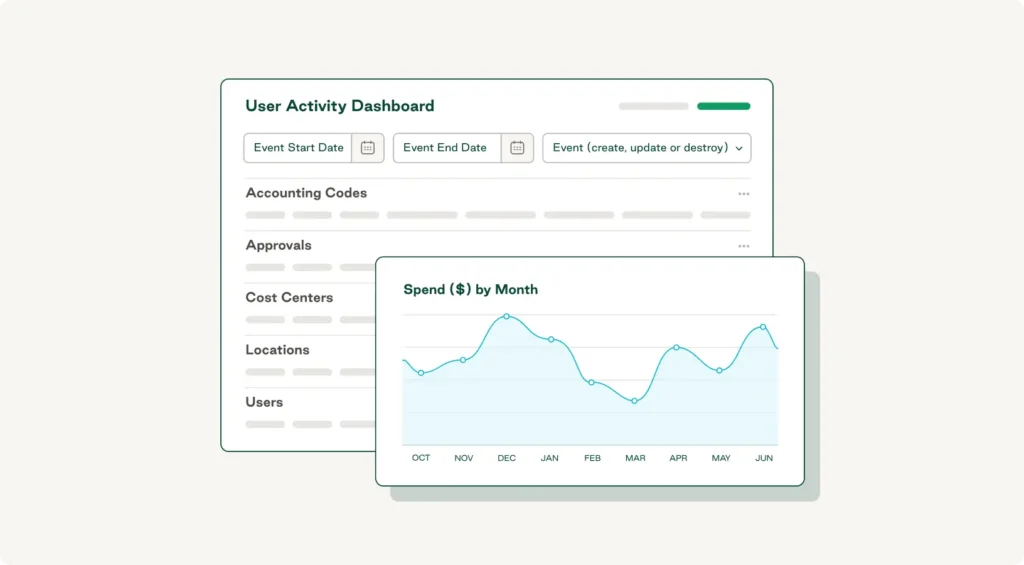
- Visualize the data. Charts and dashboards help your team grasp the variance at a glance, and a heat-map or sorted bar view often surfaces the biggest gaps faster than a line-by-line scan. If your template supports it, group by location or category so systemic variances stand out from one-off spikes.
- Plan corrective actions. Use the findings to plan specific next steps. Whether that means adjusting budgets, changing operational practices, or renegotiating a vendor agreement, the report is only valuable if it produces a decision.
Common variance reporting challenges
Variance reporting is straightforward in principle, but only when the data cooperates. Most finance teams hit the same types of obstacles, and most of them trace back to how purchasing data is captured in the first place. With a recent survey revealing that 89% of CFOs and finance leaders make monthly decisions based on inaccurate or incomplete data, the biggest fix is usually unifying data and centralizing purchasing inside a single platform.
- Inaccurate or missing data. Variances mean little when the underlying data is wrong. Decentralized purchasing can introduce errors that finance has to clean up before the report can be trusted. A procurement platform that codes every order at the point of purchase eliminates most of this work upstream.
- Departmental data silos. When each location or department manages its own vendors and invoices, key data is fragmented and hard to visualize or reconcile. Centralizing indirect spend in one system is the durable fix for most organizations.
- Poor budget context. If the rationale for the prior budget is lost, root-cause analysis becomes guesswork. Capturing budget assumptions in the same platform that captures spend means the rationale travels with the data, so your team can see why a number was set, not just what it was.
- Lack of action planning. Variance reports only drive action when the right people can see them. Shared dashboards that update in real time, with line-item context for each variance, replace the email-and-spreadsheet handoffs that slow down decisions.
- Manual reporting. Recent research shows that 40% of businesses still manage up to half of their financial data by hand, creating a lag between when spend happens and when finance sees it. When data flows through one system with spend controls built into purchasing workflows, finance gets real-time visibility. Tools with anomaly detection flag spend that breaks from established patterns, so teams see early warning signs instead of month-end surprises.
A well-structured variance report addresses most of these problems by standardizing how data is collected, calculated, and reviewed.
Variance Report Template
A variance report is a valuable tool to understand your spend and keep budget and actuals aligned. Use our template to track production and purchasing costs.
"*" indicates required fields
How to use a variance report template
A template only works if everyone uses it the same way. Use the following six-step framework to keep the process consistent and the output decision-ready.
1. Pull your actuals from your accounting system
Export the period's actuals from QuickBooks, NetSuite, Sage Intacct, or whatever GL system your team runs on. Make sure the export includes GL account, cost center, location, and vendor. Without those dimensions, you can't drill down later.
2. Enter budget figures by account and period
Populate the template's budget column with the matching budget figures for the same accounts and period. If your team built the budget at a higher level of aggregation than the actuals, map the budget down to the actuals' level of detail rather than rolling them up. Granularity is what makes the report useful.
3. Check sign conventions before reviewing variances
Confirm what favorable and unfavorable mean in your template. Most templates calculate variance as actual minus budget, so negative expense variances and positive revenue variances are favorable. Define this convention at the top of the template so reviewers don't have to figure it out each time.
4. Flag variances that exceed your materiality threshold
Set a materiality threshold, often 5–10% or a dollar amount, and flag every line that exceeds it in either direction (favorable or unfavorable). A favorable variance can also signal a flawed forecast or a missed opportunity to deploy budget. This focuses the review on what matters without losing the small persistent variances that aggregate into something material.
5. Draft a brief explanation for each significant variance
For each flagged line, write one or two sentences explaining the cause: a vendor price increase, a seasonal volume shift, a delayed project, or a one-time order. The discipline of writing the cause forces specificity, and it gives the next reviewer something concrete to work with.
6. Route the completed report for review and sign-off
Send the completed report to the relevant department heads, regional ops leaders, and the CFO or controller. Capture their feedback inline, then file the final version as the record for that period. Using the same template the next period builds period-over-period comparability automatically.
Free variance report template
Order.co's free variance report template gives finance teams a standardized starting point so analysis stays consistent every period. The template includes:
- Budget vs. actual columns for both expenses and revenue
- Pre-built variance calculation (both dollar and percentage)
- Period-over-period comparison columns to spot trends
- A summary view that rolls line items up by account or location
- Built-in sign convention labels, so ‘favorable’ and ‘unfavorable’ are clear from the start
To access the template:
- Enter your information to receive the file via Google Sheets or Excel
- Save a copy to your own drive
- Populate the budget and actuals columns for the period you're reviewing
- Get an immediate snapshot of budget vs. actual performance
Download the variance report template
Stay ahead of budget variance across your organization with Order.co
With manual variance reporting, finance teams may spend the first week of every close aggregating disconnected data, reconciling miscoded invoices, and waiting on location managers to confirm what was actually bought, wasting time and discovering issues too late.
Order.co’s procurement and finance automation platform builds visibility into purchasing from the start, so variances surface as they happen rather than at month-end close. Every line item is coded to the right GL account, cost center, and location at the moment of purchase so finance sees variance at the level where decisions are made. Anomaly detection flags spend that deviates from established patterns, giving you the context to tell location-specific issues apart from systemic ones. And because everything happens in real time, you catch budget drift while there's still time to recover.
Schedule a demo to see what your close cycle looks like when variance shows up in real time.
FAQs about variance report templates
Variance reports typically distinguish between price, volume, and efficiency variance. Price variance compares the price you paid for an input to the budgeted price. Volume variance compares actual quantity to planned quantity, which matters most for production or sales lines. Efficiency variance measures how well resources were used against plan, often in hours, units, or output per input. A good template surfaces all three in one view.
Most finance teams set materiality at 5-10% of the budget line or a fixed dollar amount, whichever is higher. The threshold depends on the size of the line and how volatile the category is. Cleaning supplies at a 12% overspend means something different than payroll at a 12% overspend. Small persistent variances should still get flagged at the line-item level, even when they fall under the threshold individually, because they compound into material numbers over time.
Most finance teams run variance reports monthly, aligned with the close cycle, with deeper quarterly and annual reviews. Multi-location businesses often benefit from a weekly check on high-variance categories, especially indirect spend, where small leaks add up quickly. With real-time spend data from a procurement platform, you can monitor variance continuously, which shortens the time from anomaly to corrective action.
Get started
Schedule a demo to see how Order.co can simplify buying for your business.
"*" indicates required fields